
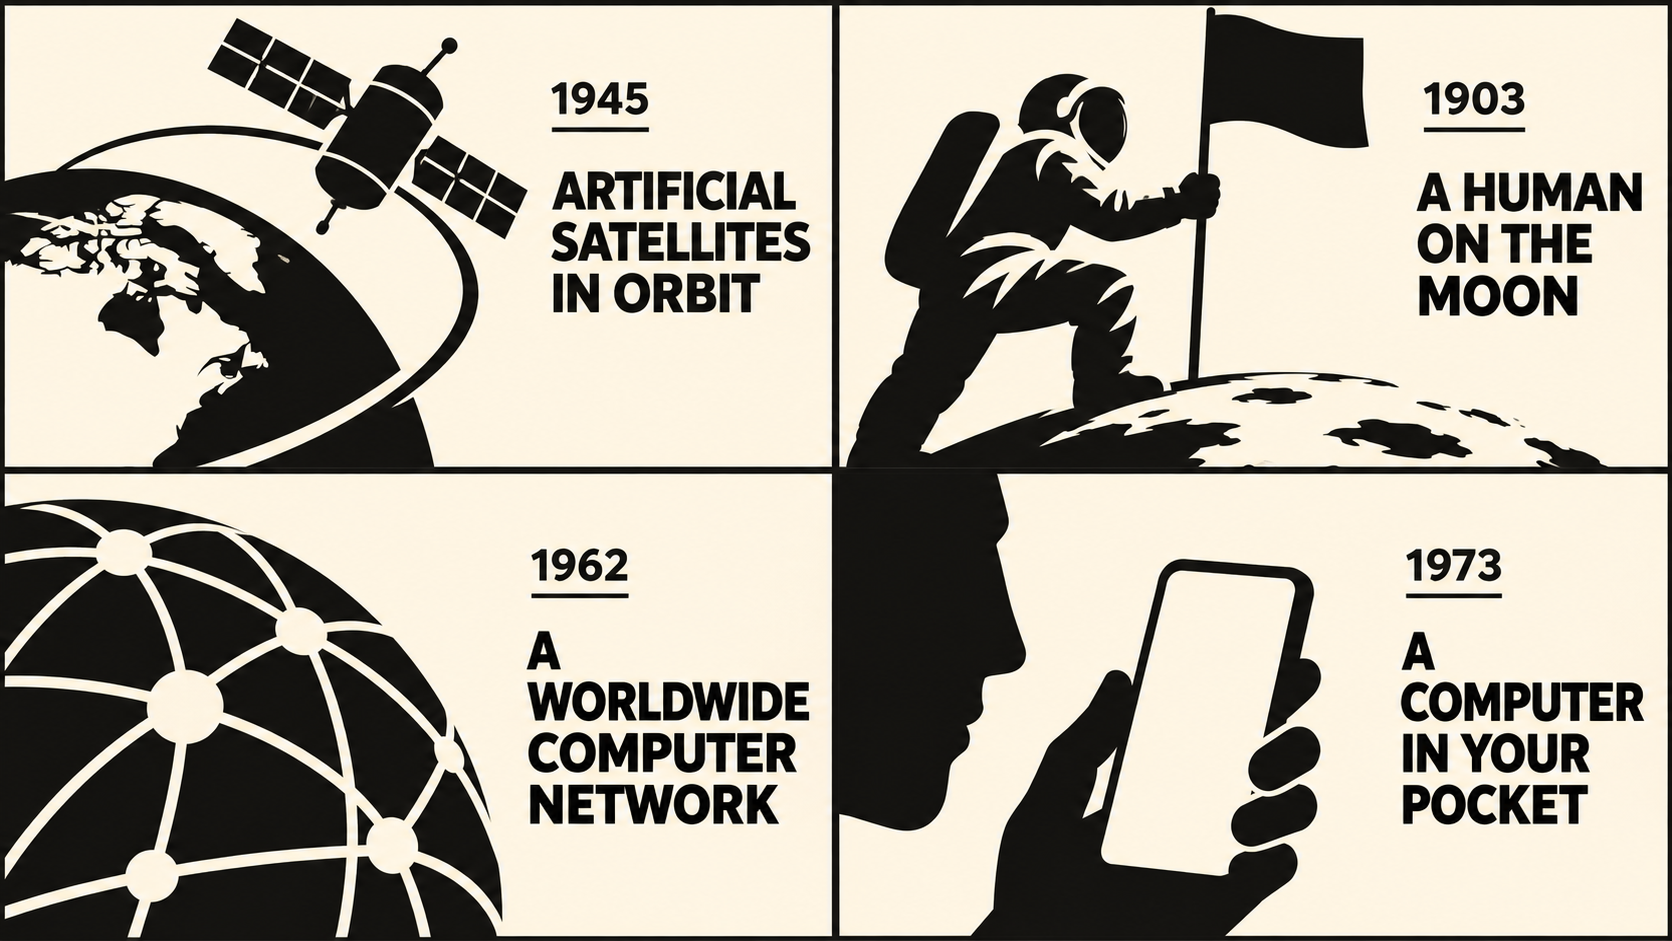
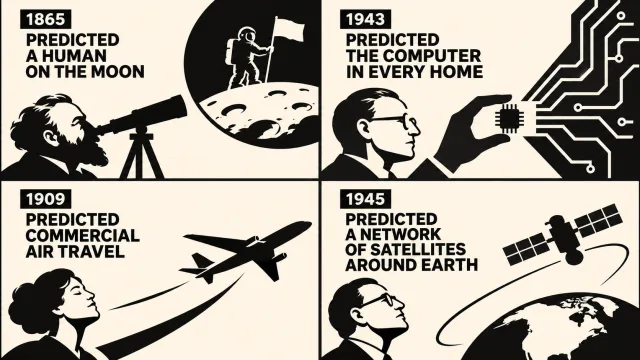
Past Predictions of the Future in a Black-and-White Four-Panel Infographic
Prompt
2x2 grid, 16:9, do this for 4 real predictions for the future from the past with their year: INPUT :: $ TOPIC

S = semantic_analysis($ TOPIC)

A = infer_dominant_force(S)
B = infer_contrasting_entity(S)
V = infer_decisive_action(A,B)
M = infer_metaphor(A,B,V)

=========================================
VISUAL EQUATION
=========================================

FINAL_ARTWORK =

    [ A ^ SCALE_EXAGGERATION ]

            ⊗

    [ V ^ SEMANTIC_MEANING ]

            →

    [ B ^ CONTRASTING_SCALE ]

            +

    NEGATIVE_SPACE

            +

    MINIMAL_EDITORIAL_TYPE

            ×

    TWO_TONE_VECTOR_LANGUAGE

            -

    (
      decorative_noise
      + literal_explanation
      + unnecessary_objects
      + realistic_scale
      + secondary_visual_stories
    )

=========================================
SEMANTIC RULE
=========================================

Visual magnitude is proportional to conceptual
importance, not real-world physical size.

size(A) ∝ semantic_power(A)

size(B) ∝ narrative_counterpoint(B)

interaction(A,B) = thesis(S)

=========================================
RENDER RULE
=========================================

Black silhouettes.
Warm-white background.
No gradients.
No photorealism.

Use dramatic cropping and one physical action
to express the central idea.

Choose scale relationships intelligently:
not every topic implies conflict,
danger, victimhood, or dominance.
Summary
Depict predictions of the future made in the past as a 2×2 infographic labeled with years. A minimalist illustration using black silhouettes, negative space, and contrasts in scale. Please verify the generated years and historical content separately before use.